Forward-Looking Probability Infrastructure for Investment Teams

Receive market-implied distributions, not just point forecasts.

MRP converts current market prices into forward-looking probability distributions and derived signals, allowing clients to augment their portfolio analytics, identify asymmetric risk, and monitor changing market regimes.

S&P 500 · 1-Month Horizon — as of March 2, 2026
Expected Return
+0.73%
Positive market-implied median outcome
Probability of Gain
48.5%
Fewer than half of outcomes are positive
Skew
Negative
Downside asymmetry remains elevated
Tail Risk
Moderate
Tail losses are broadly in line with normal models
Multiple Assets, a Range of Horizons
Market Forecast Examples
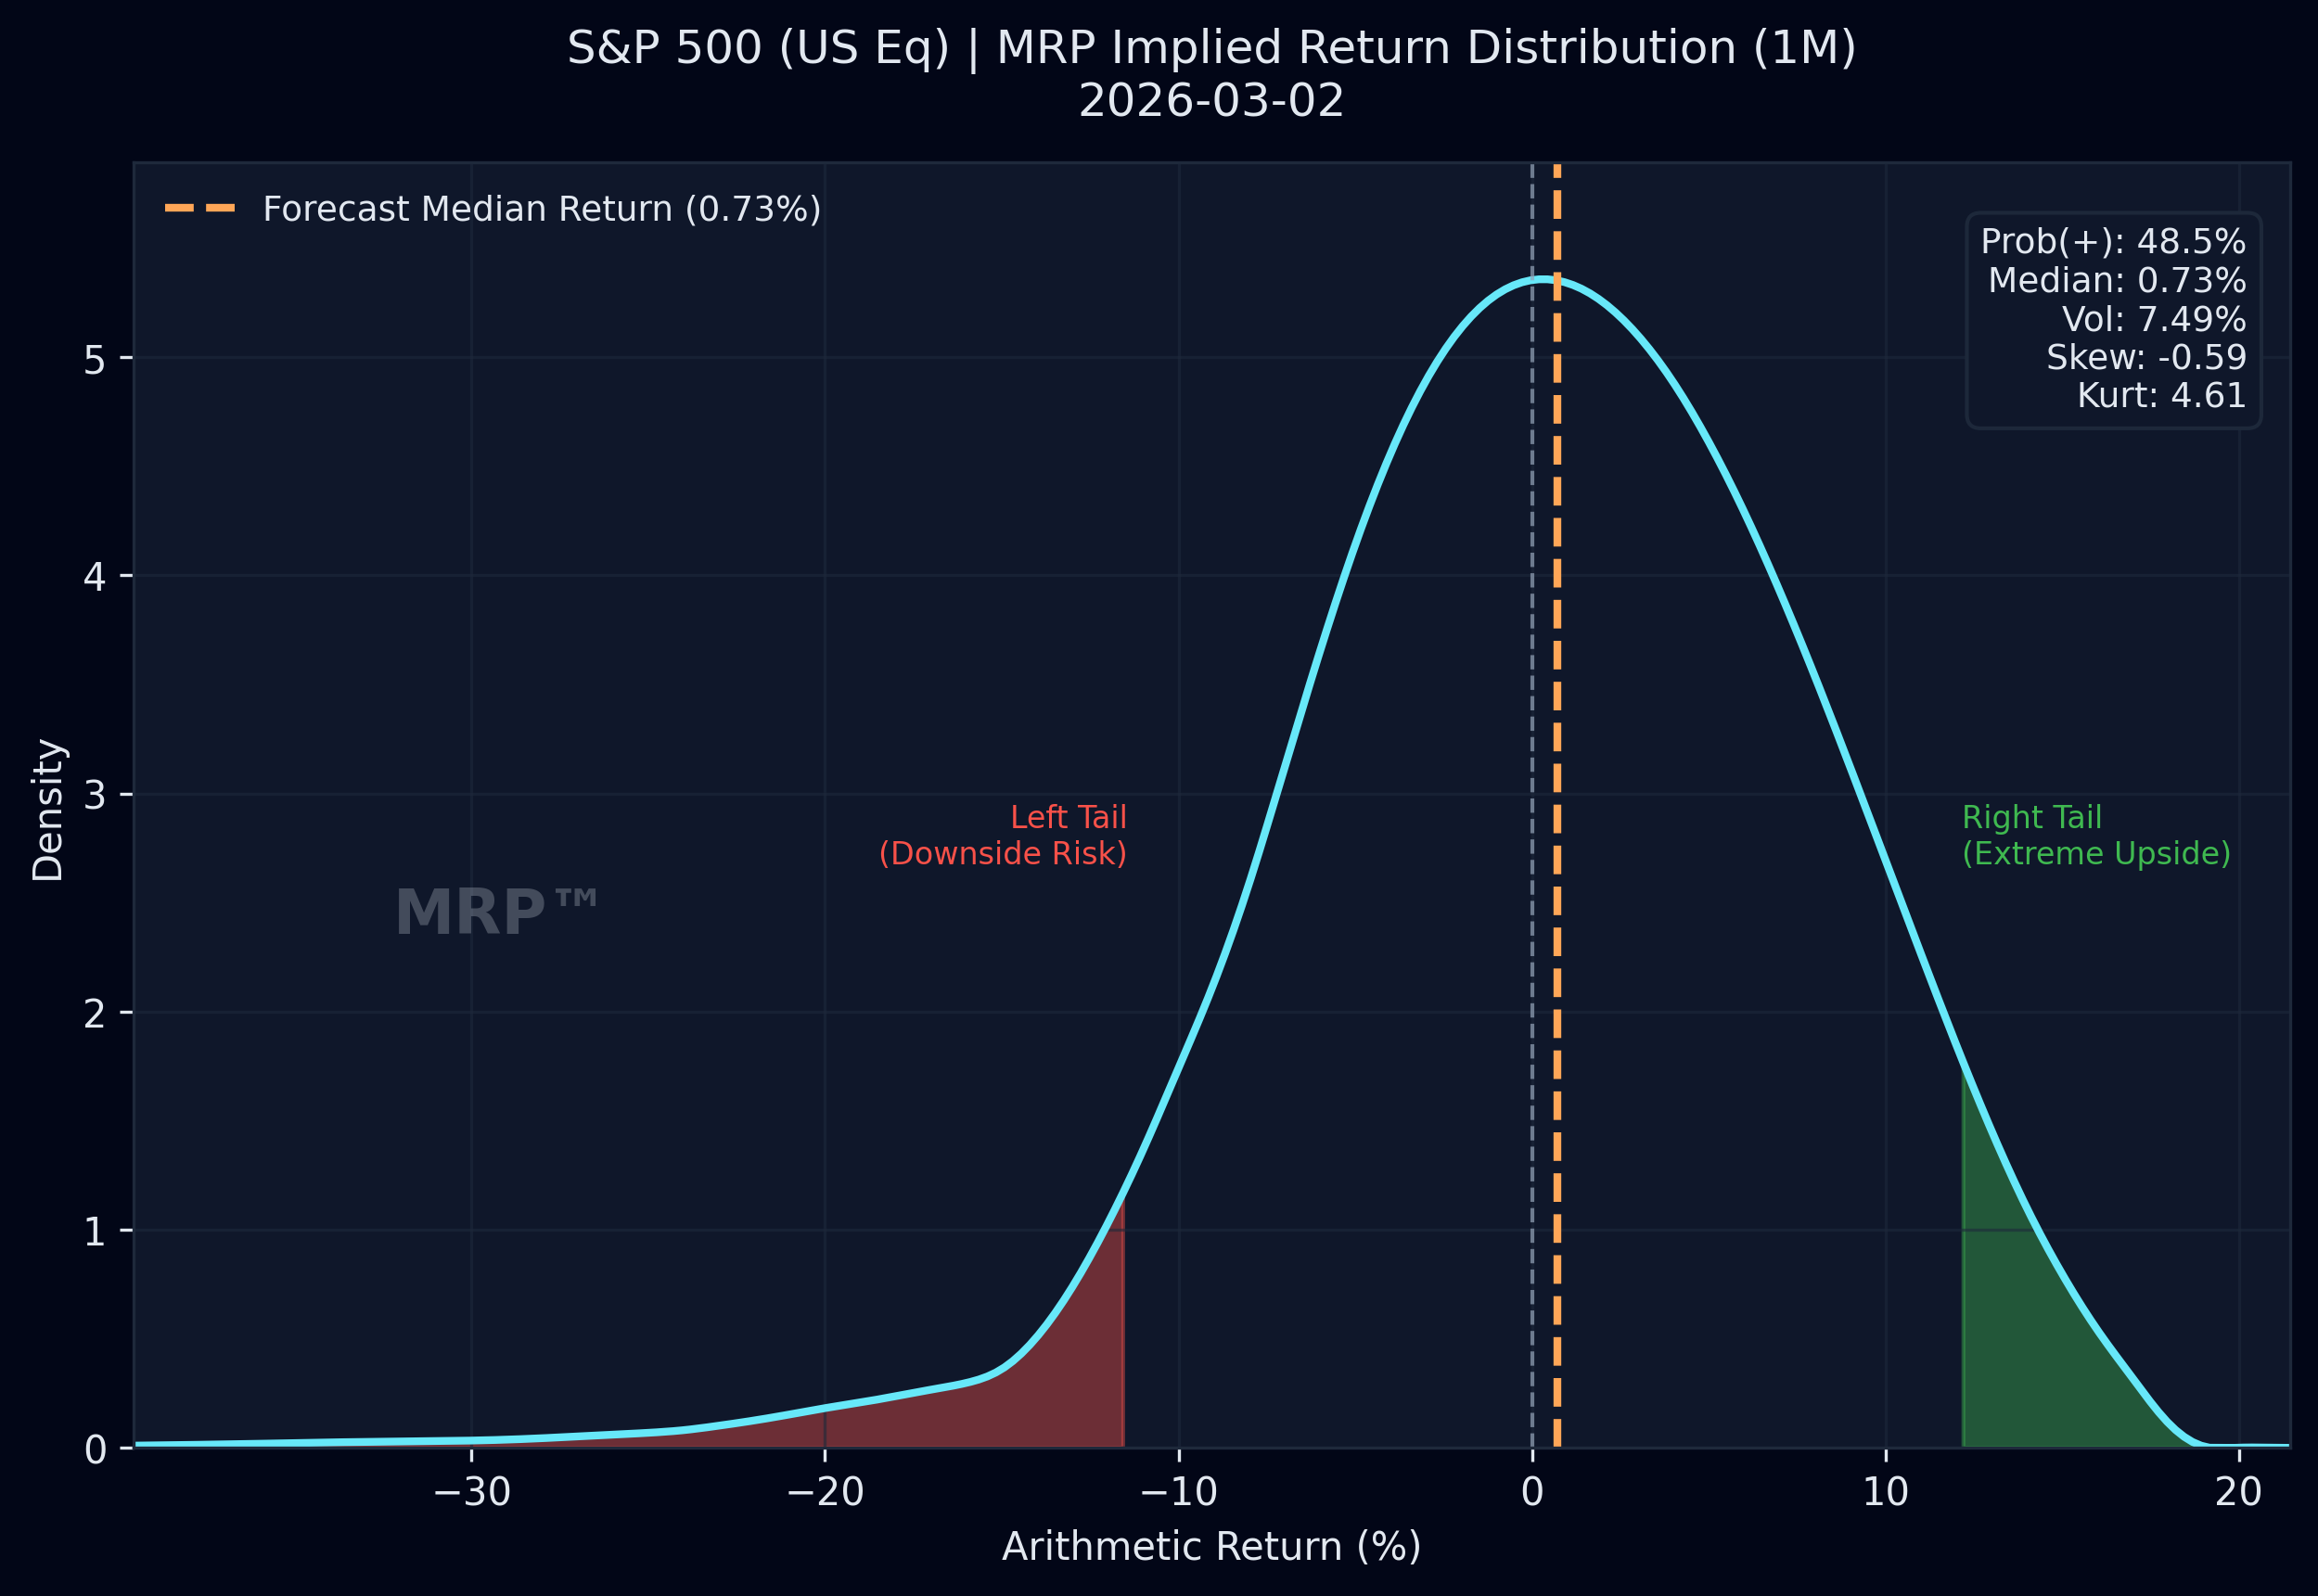
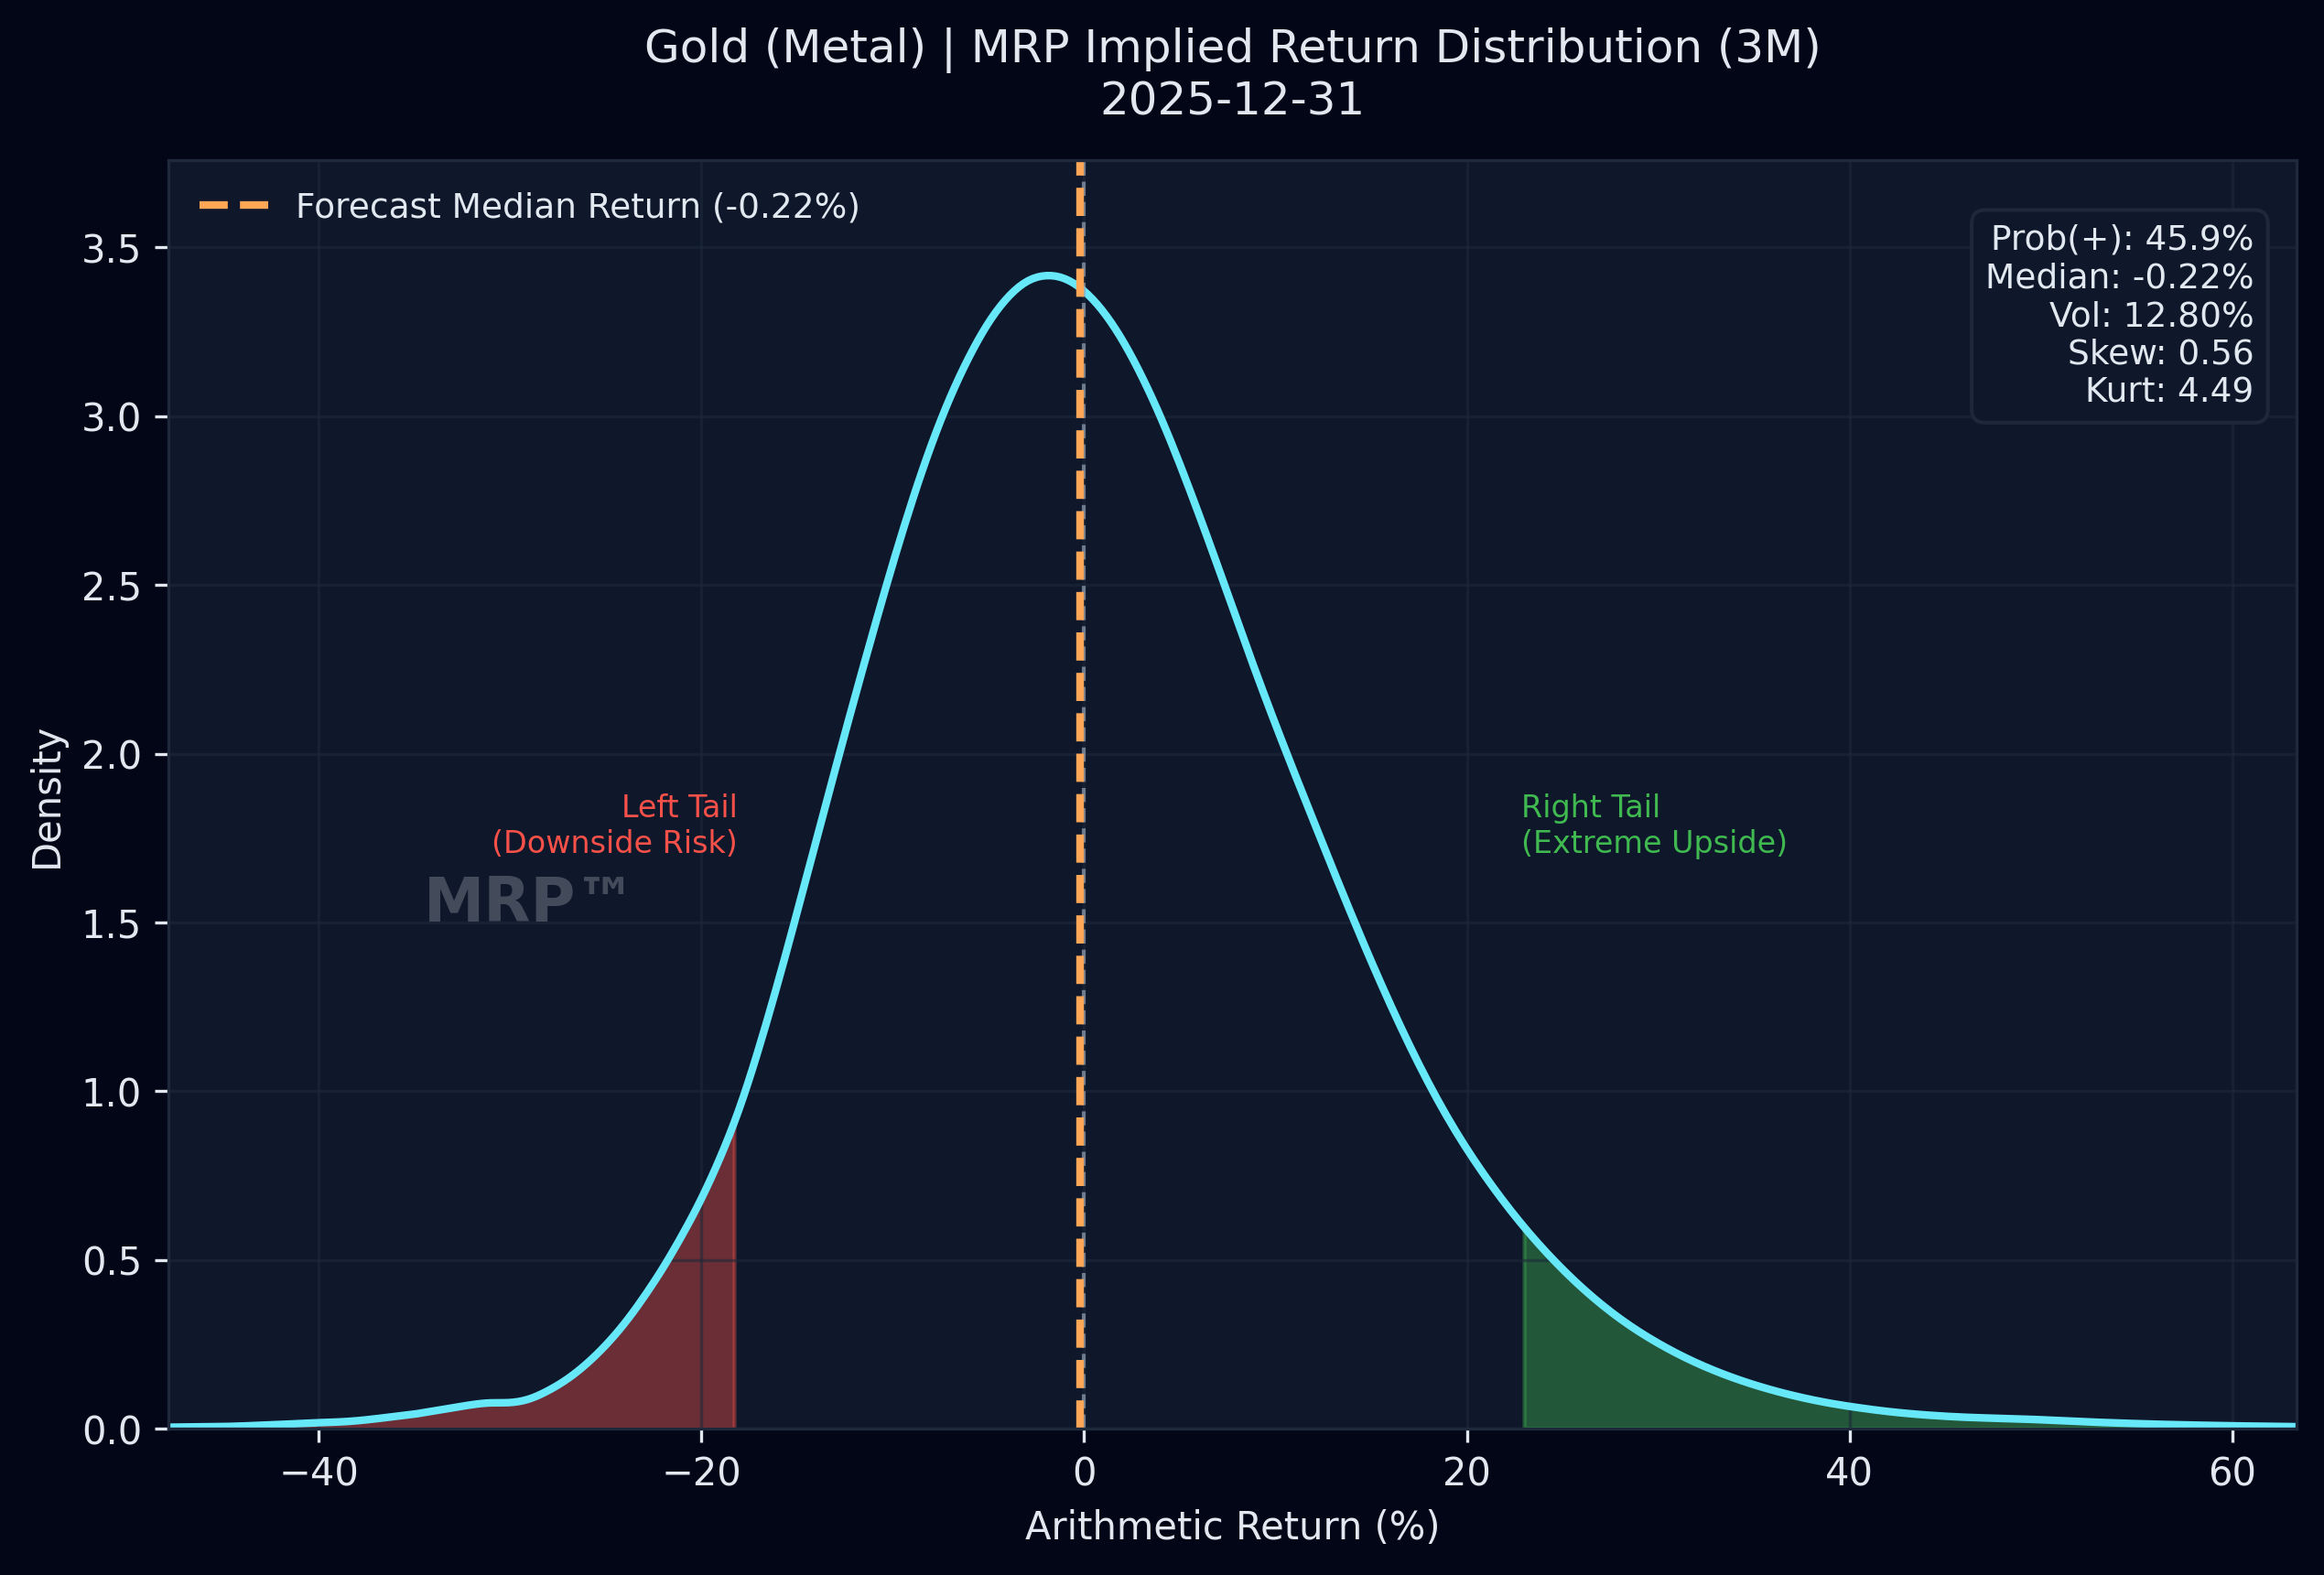
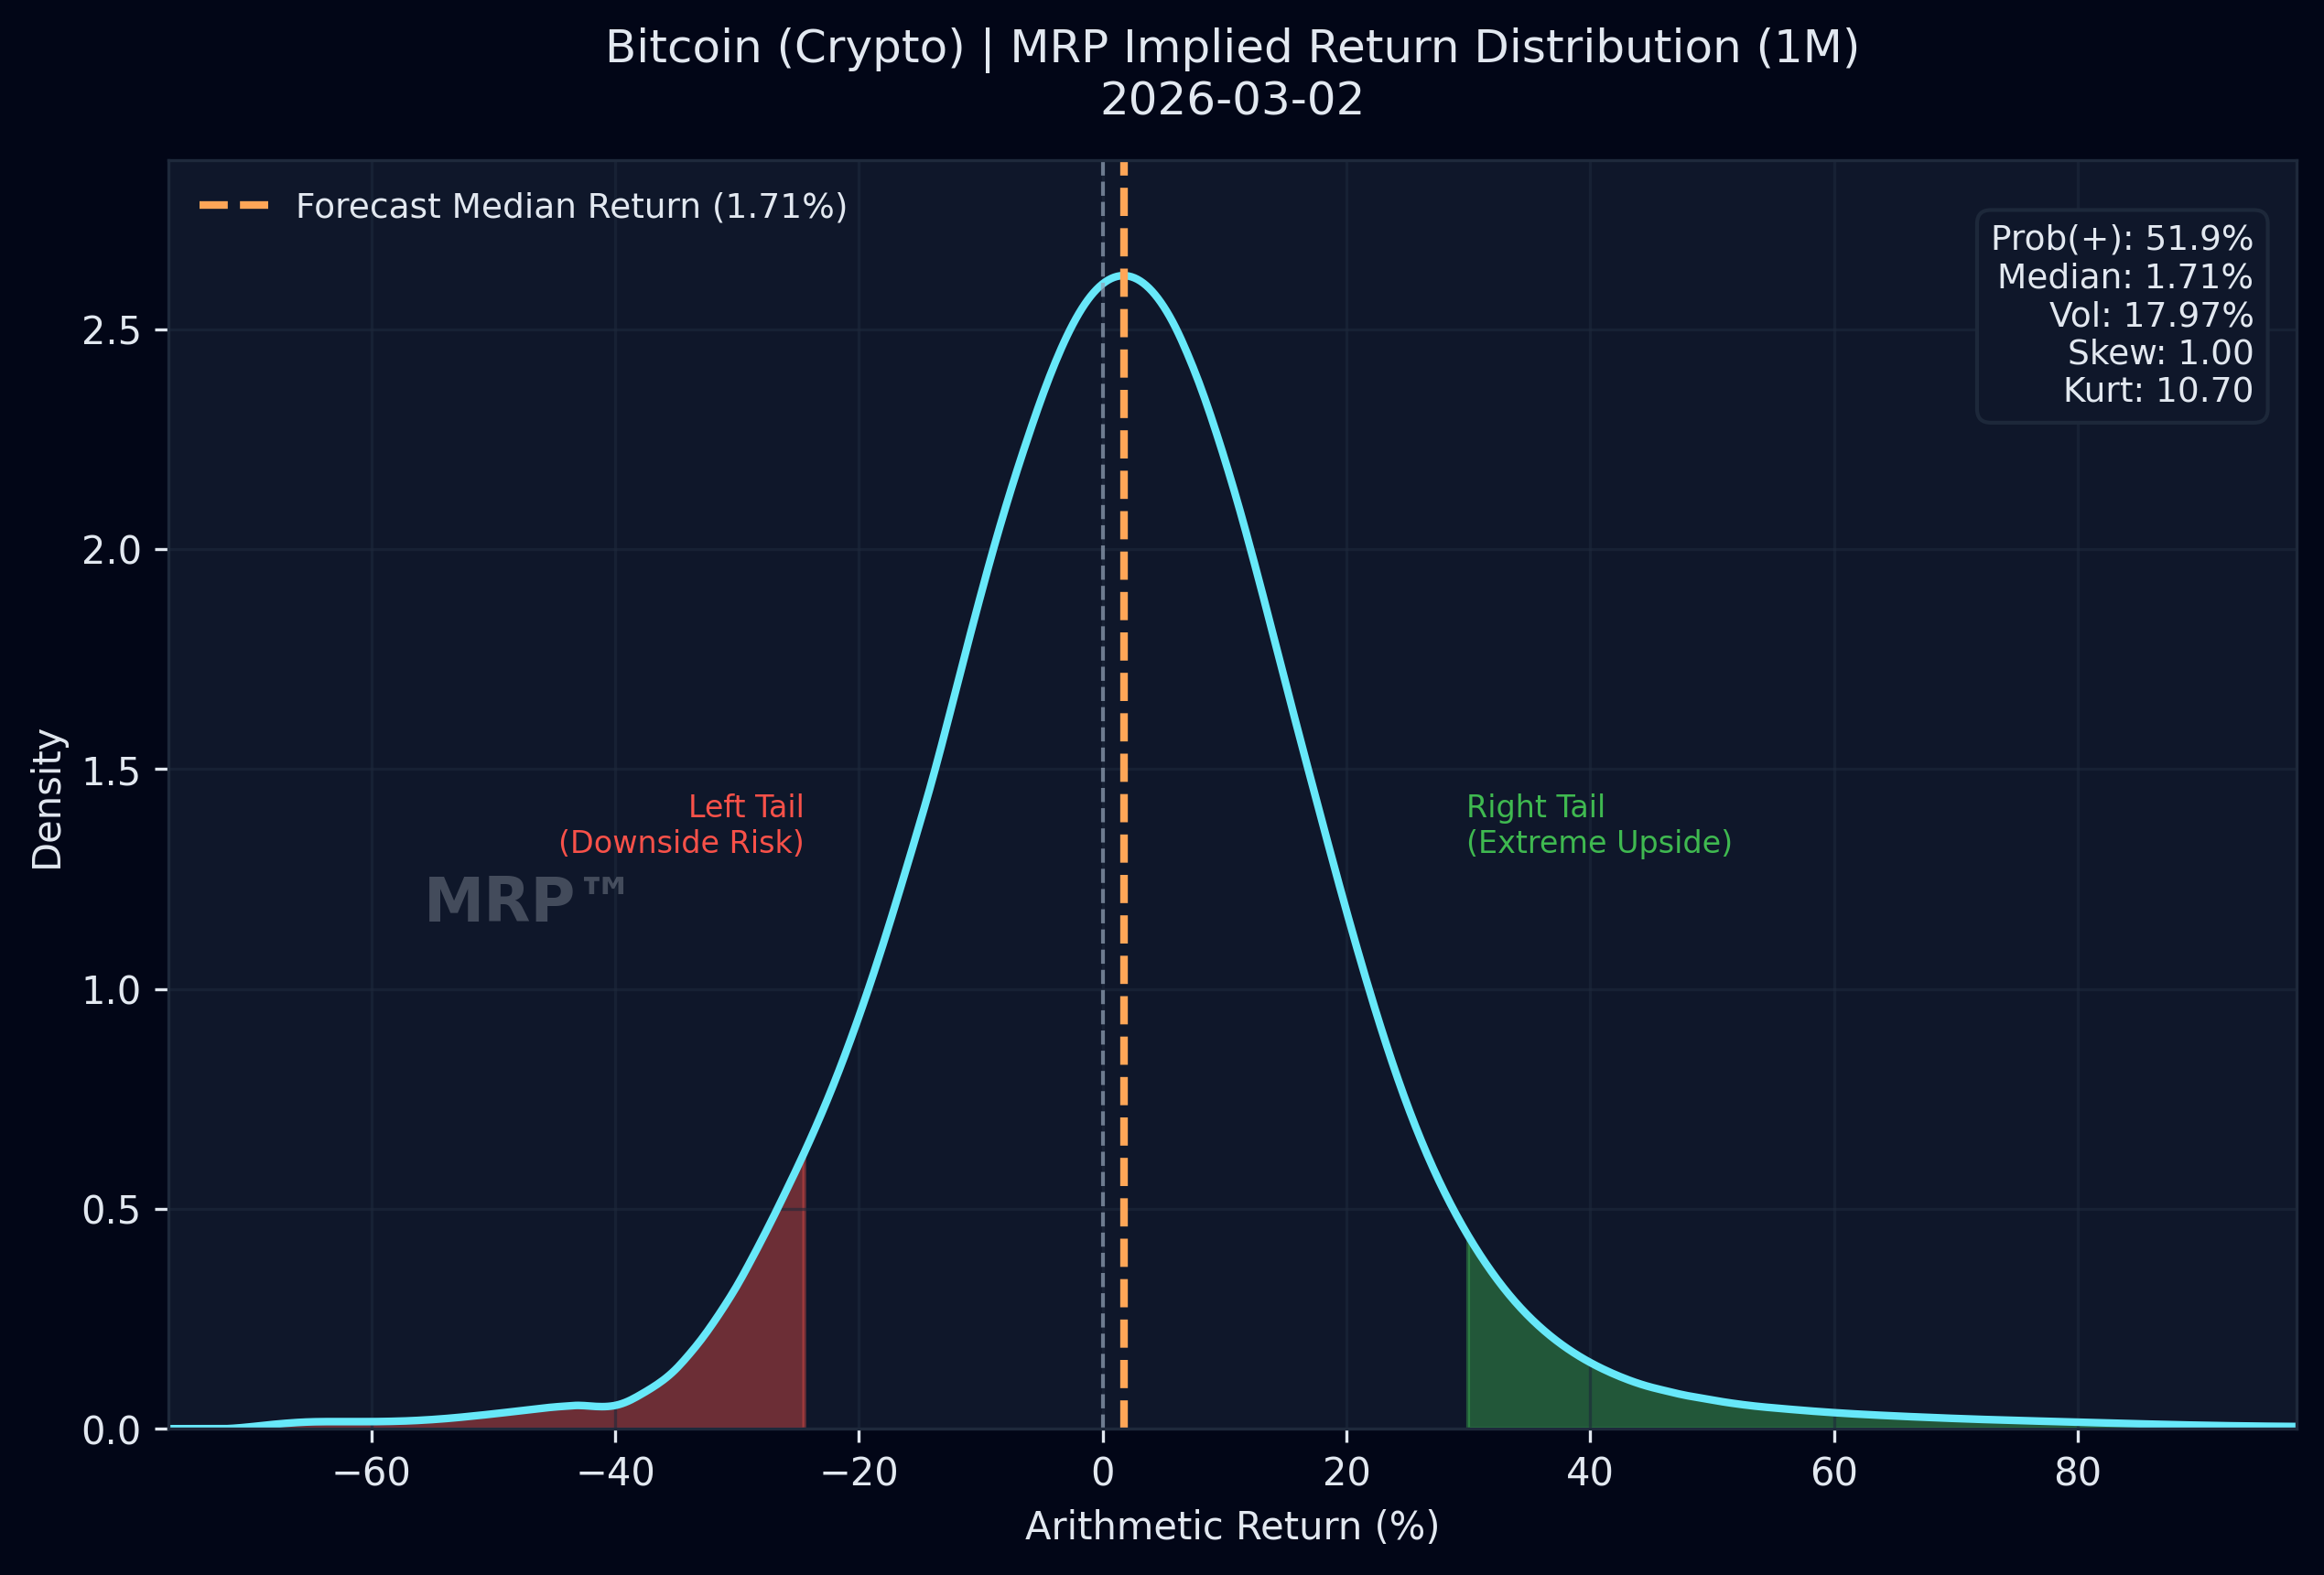
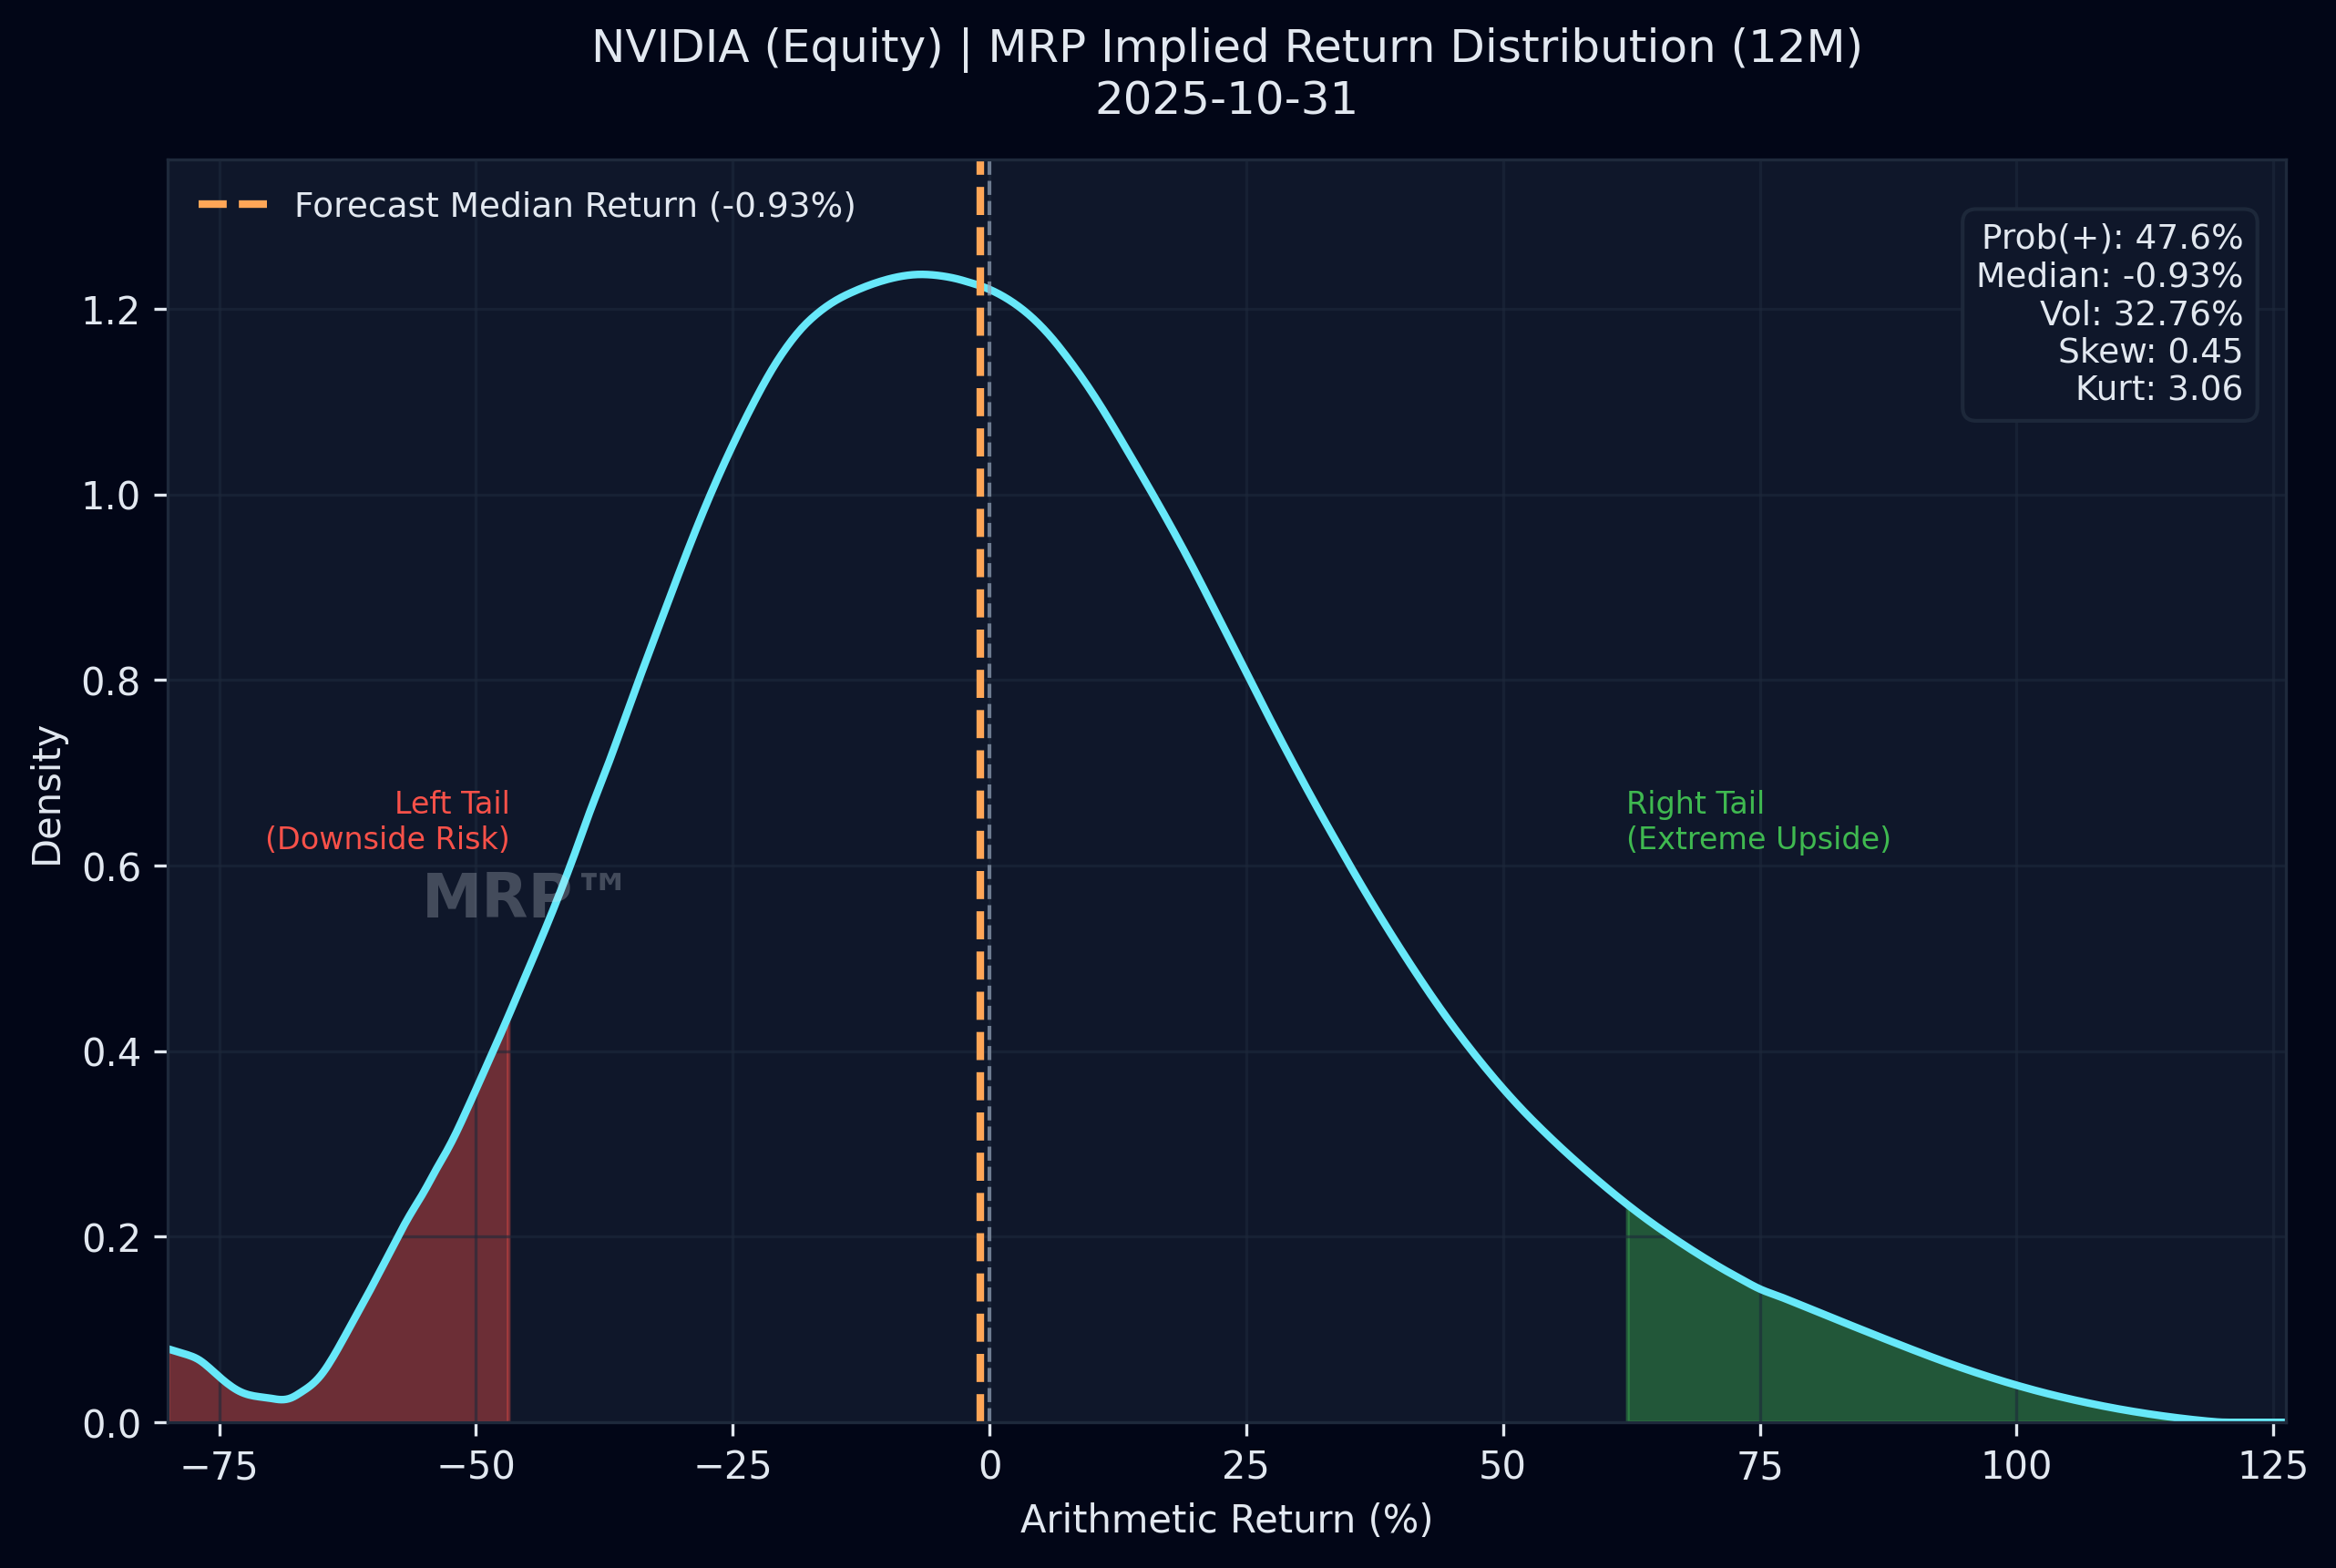
S&P 500 · 1M Gold · 3M Bitcoin · 1M NVIDIA · 12M 20+Y UST · 6M
S&P 500 market-implied return distribution, 1-Month horizon Gold market-implied return distribution, 3-Month horizon Bitcoin market-implied return distribution, 1-Month horizon NVIDIA market-implied return distribution, 12-Month horizon 20+Y UST market-implied return distribution, 6-Month horizon
Interpretation
Market-implied 1-month S&P 500 returns show modest median gain with balanced positive probability
Why it matters
Highlights mixed near-term market expectations with moderate downside risk relative to historical norms
Interpretation
Market-implied 3-month gold returns show modestly negative median with balanced positive return chances
Why it matters
Reflects market expectations of limited near-term gains and moderate uncertainty for portfolio risk assessment
Interpretation
Market-implied 1-month Bitcoin returns show modestly favorable median with balanced positive probability
Why it matters
Highlights a market view of modest upside potential amid balanced likelihood of gains or losses
Interpretation
Market-implied 12-month return distribution for NVIDIA shows modestly negative median with balanced positive return probability
Why it matters
Reflects market expectations of mixed outcomes with moderate tail risk influencing risk assessment over the horizon
Interpretation
Market-implied 6-month return for 20+Y UST modestly negative with balanced positive return chances
Why it matters
Highlights a cautious outlook with moderate asymmetry and tail risk relevant for risk assessment
The Opportunity

Current market prices already contain forward-looking information. Most investors do not extract it in a usable form.

The problem

Traditional capital market assumptions are often backward-looking, variance-based, and slow to reflect changing market conditions or asymmetric risk.

The MRP approach

MRP distributes the full market-implied probability distribution and the time series of its parameters, giving clients a richer input layer for their own analytics.

How it is used by clients

To improve internal asset-allocation frameworks, enhance scenario analysis, monitor regime shifts, identify selected high-confidence drawdown signals, and analyze periods when returns are persistently favorable.

Product Offering

Built to serve both as a data product and as a probability framework for client analytics.

Core Products

Forward-looking probability distributions derived from current market prices, delivered as structured output your team can use directly.

  • Distribution curves by asset
  • Expected return, volatility, skew, kurtosis
  • CSV / Excel / API-ready outputs
Parameter Time Series

Historical evolution of distribution characteristics, allowing investment teams to evaluate changing market expectations and asymmetry through time.

  • Skew and tail-risk history
  • Regime pattern recognition
  • Enhanced monitoring and research
Derived Signals

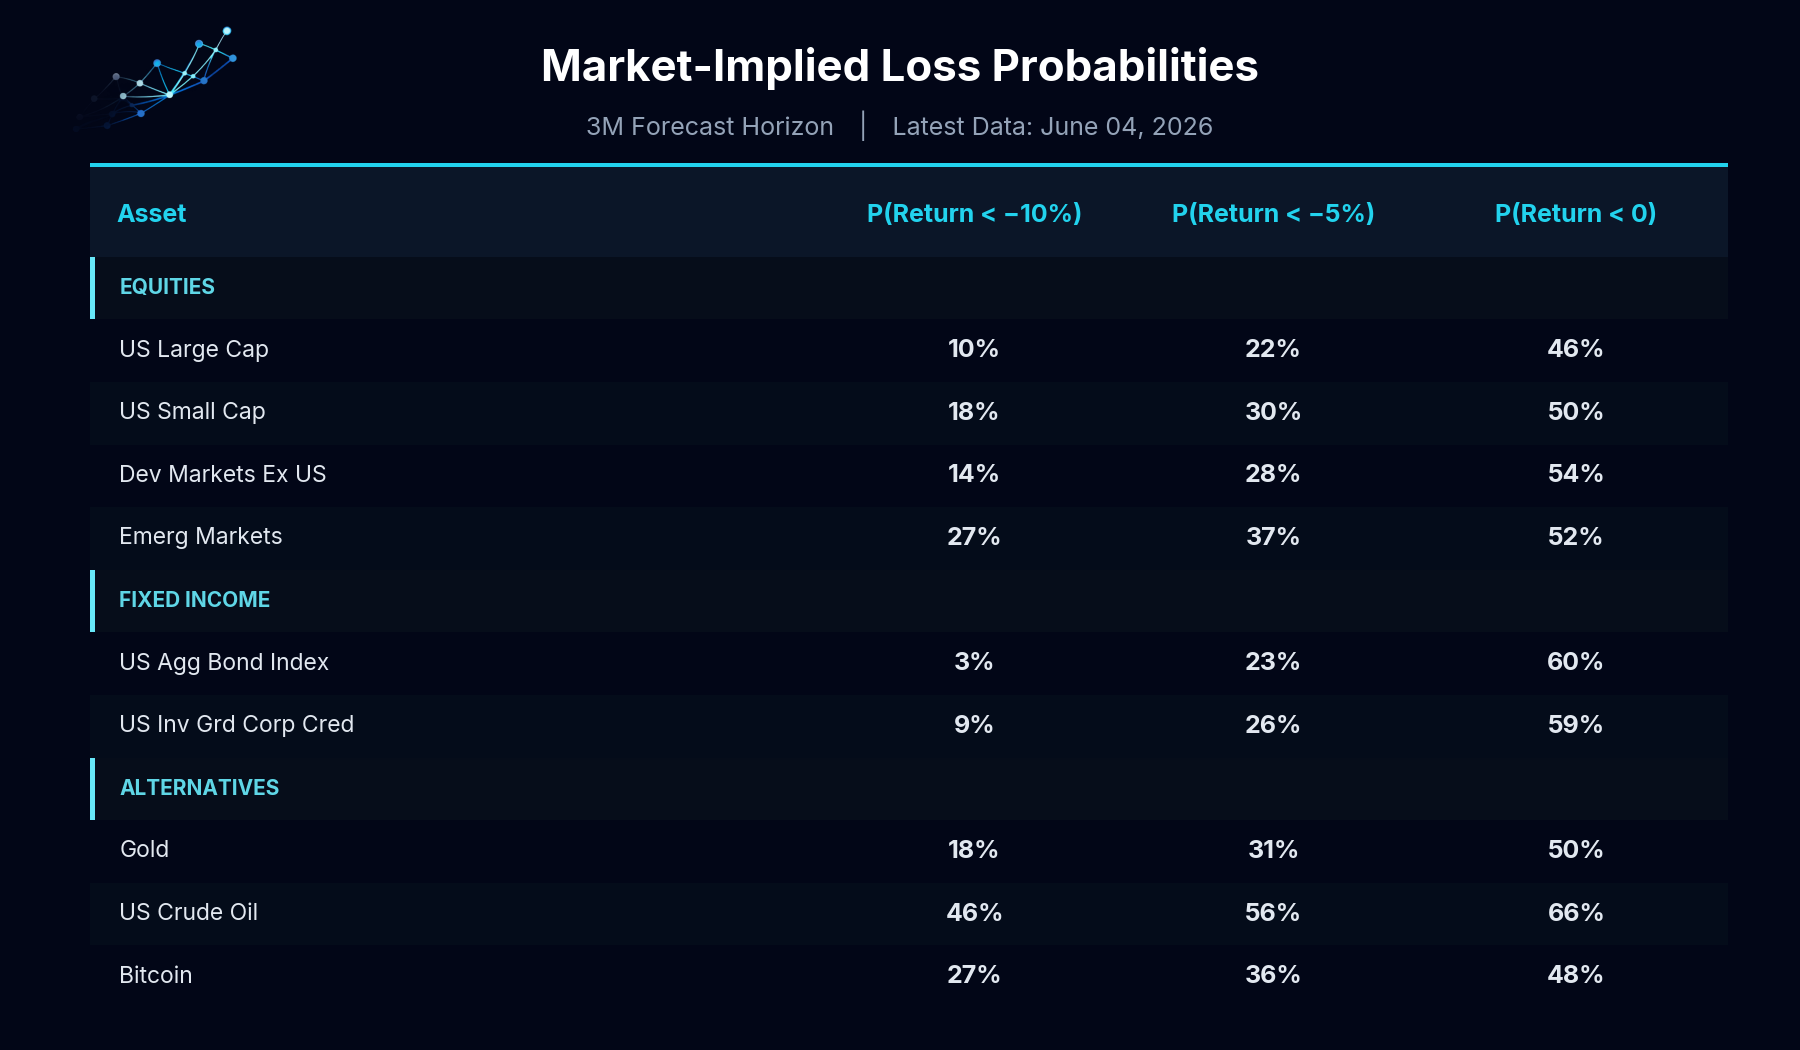
High-conviction signals can be built from the time series of distribution parameters flagging favorable return environments and selected drawdown risks.

  • High-confidence downside warnings
  • Positive-return regime identification
  • Designed to complement existing process
Chart Framework

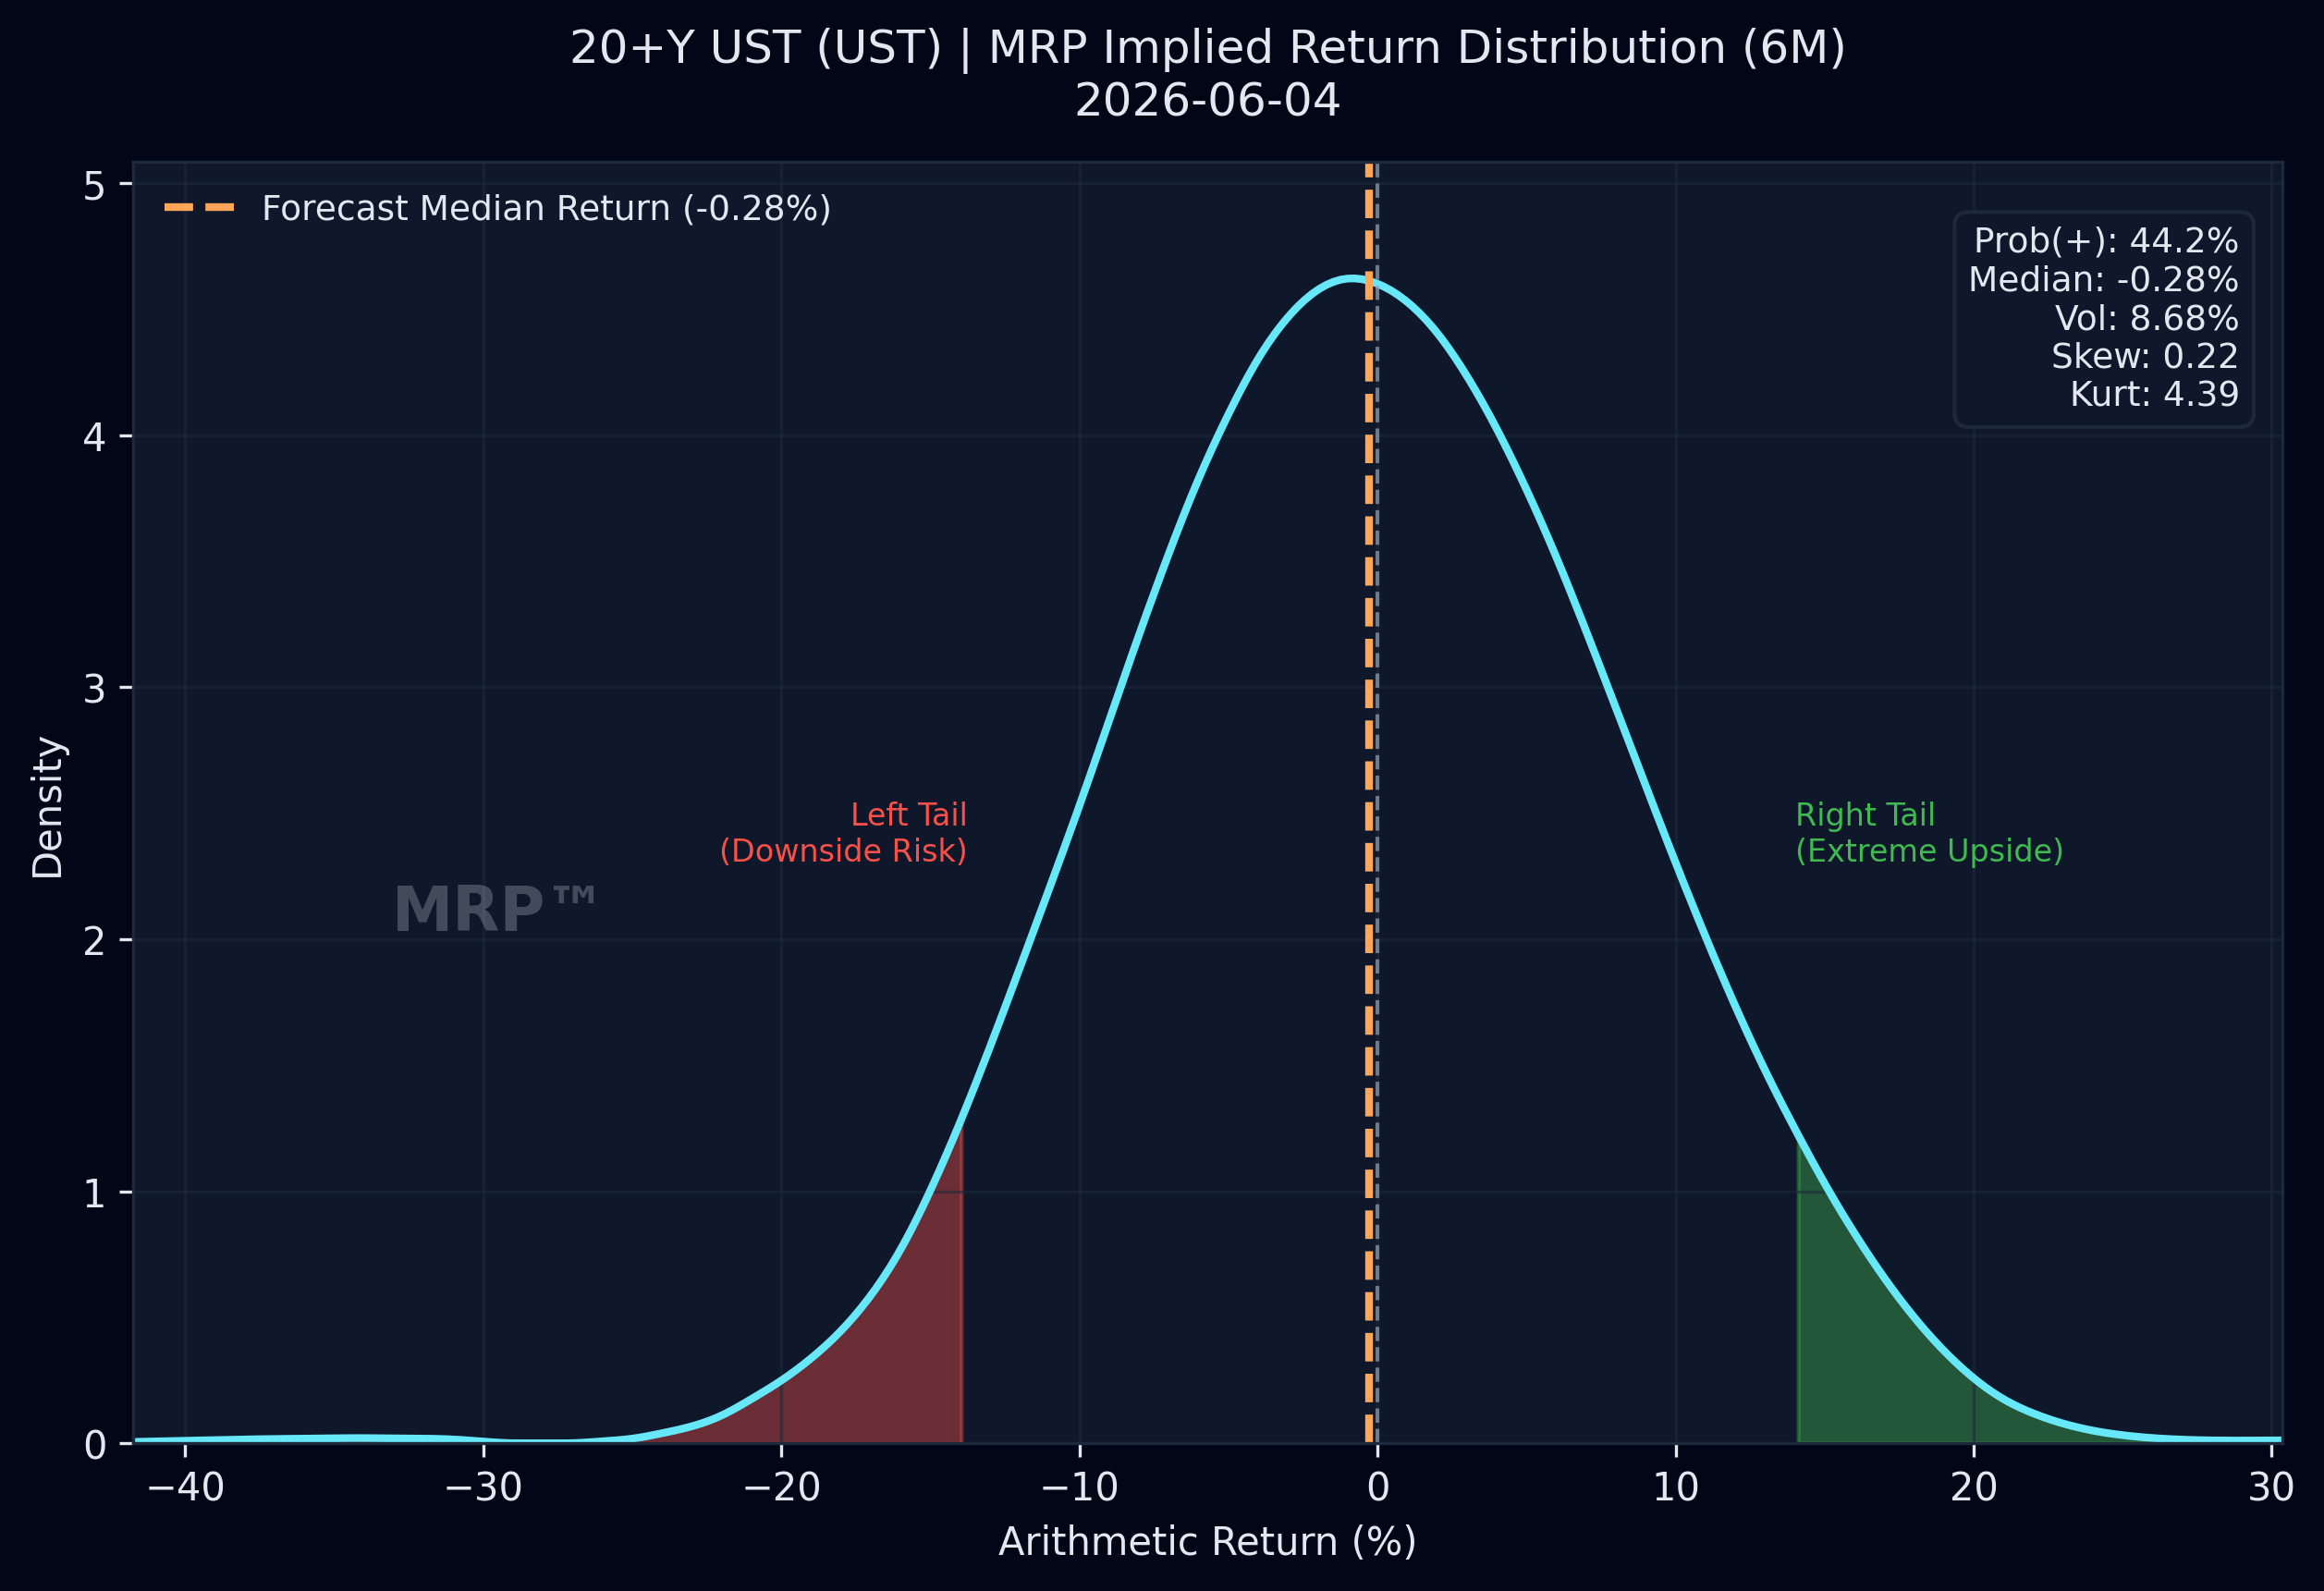
Forward-looking probability examples.

Chart 1

Market-Implied Distribution

Market-implied return distribution
This illustrates the fundamental product. Future distributions reveal how the market is pricing the future, including the probability of outcomes and the associated asymmetry and tail exposure. The underlying data can then be used for allocation, risk management, and internal research.
Chart 2

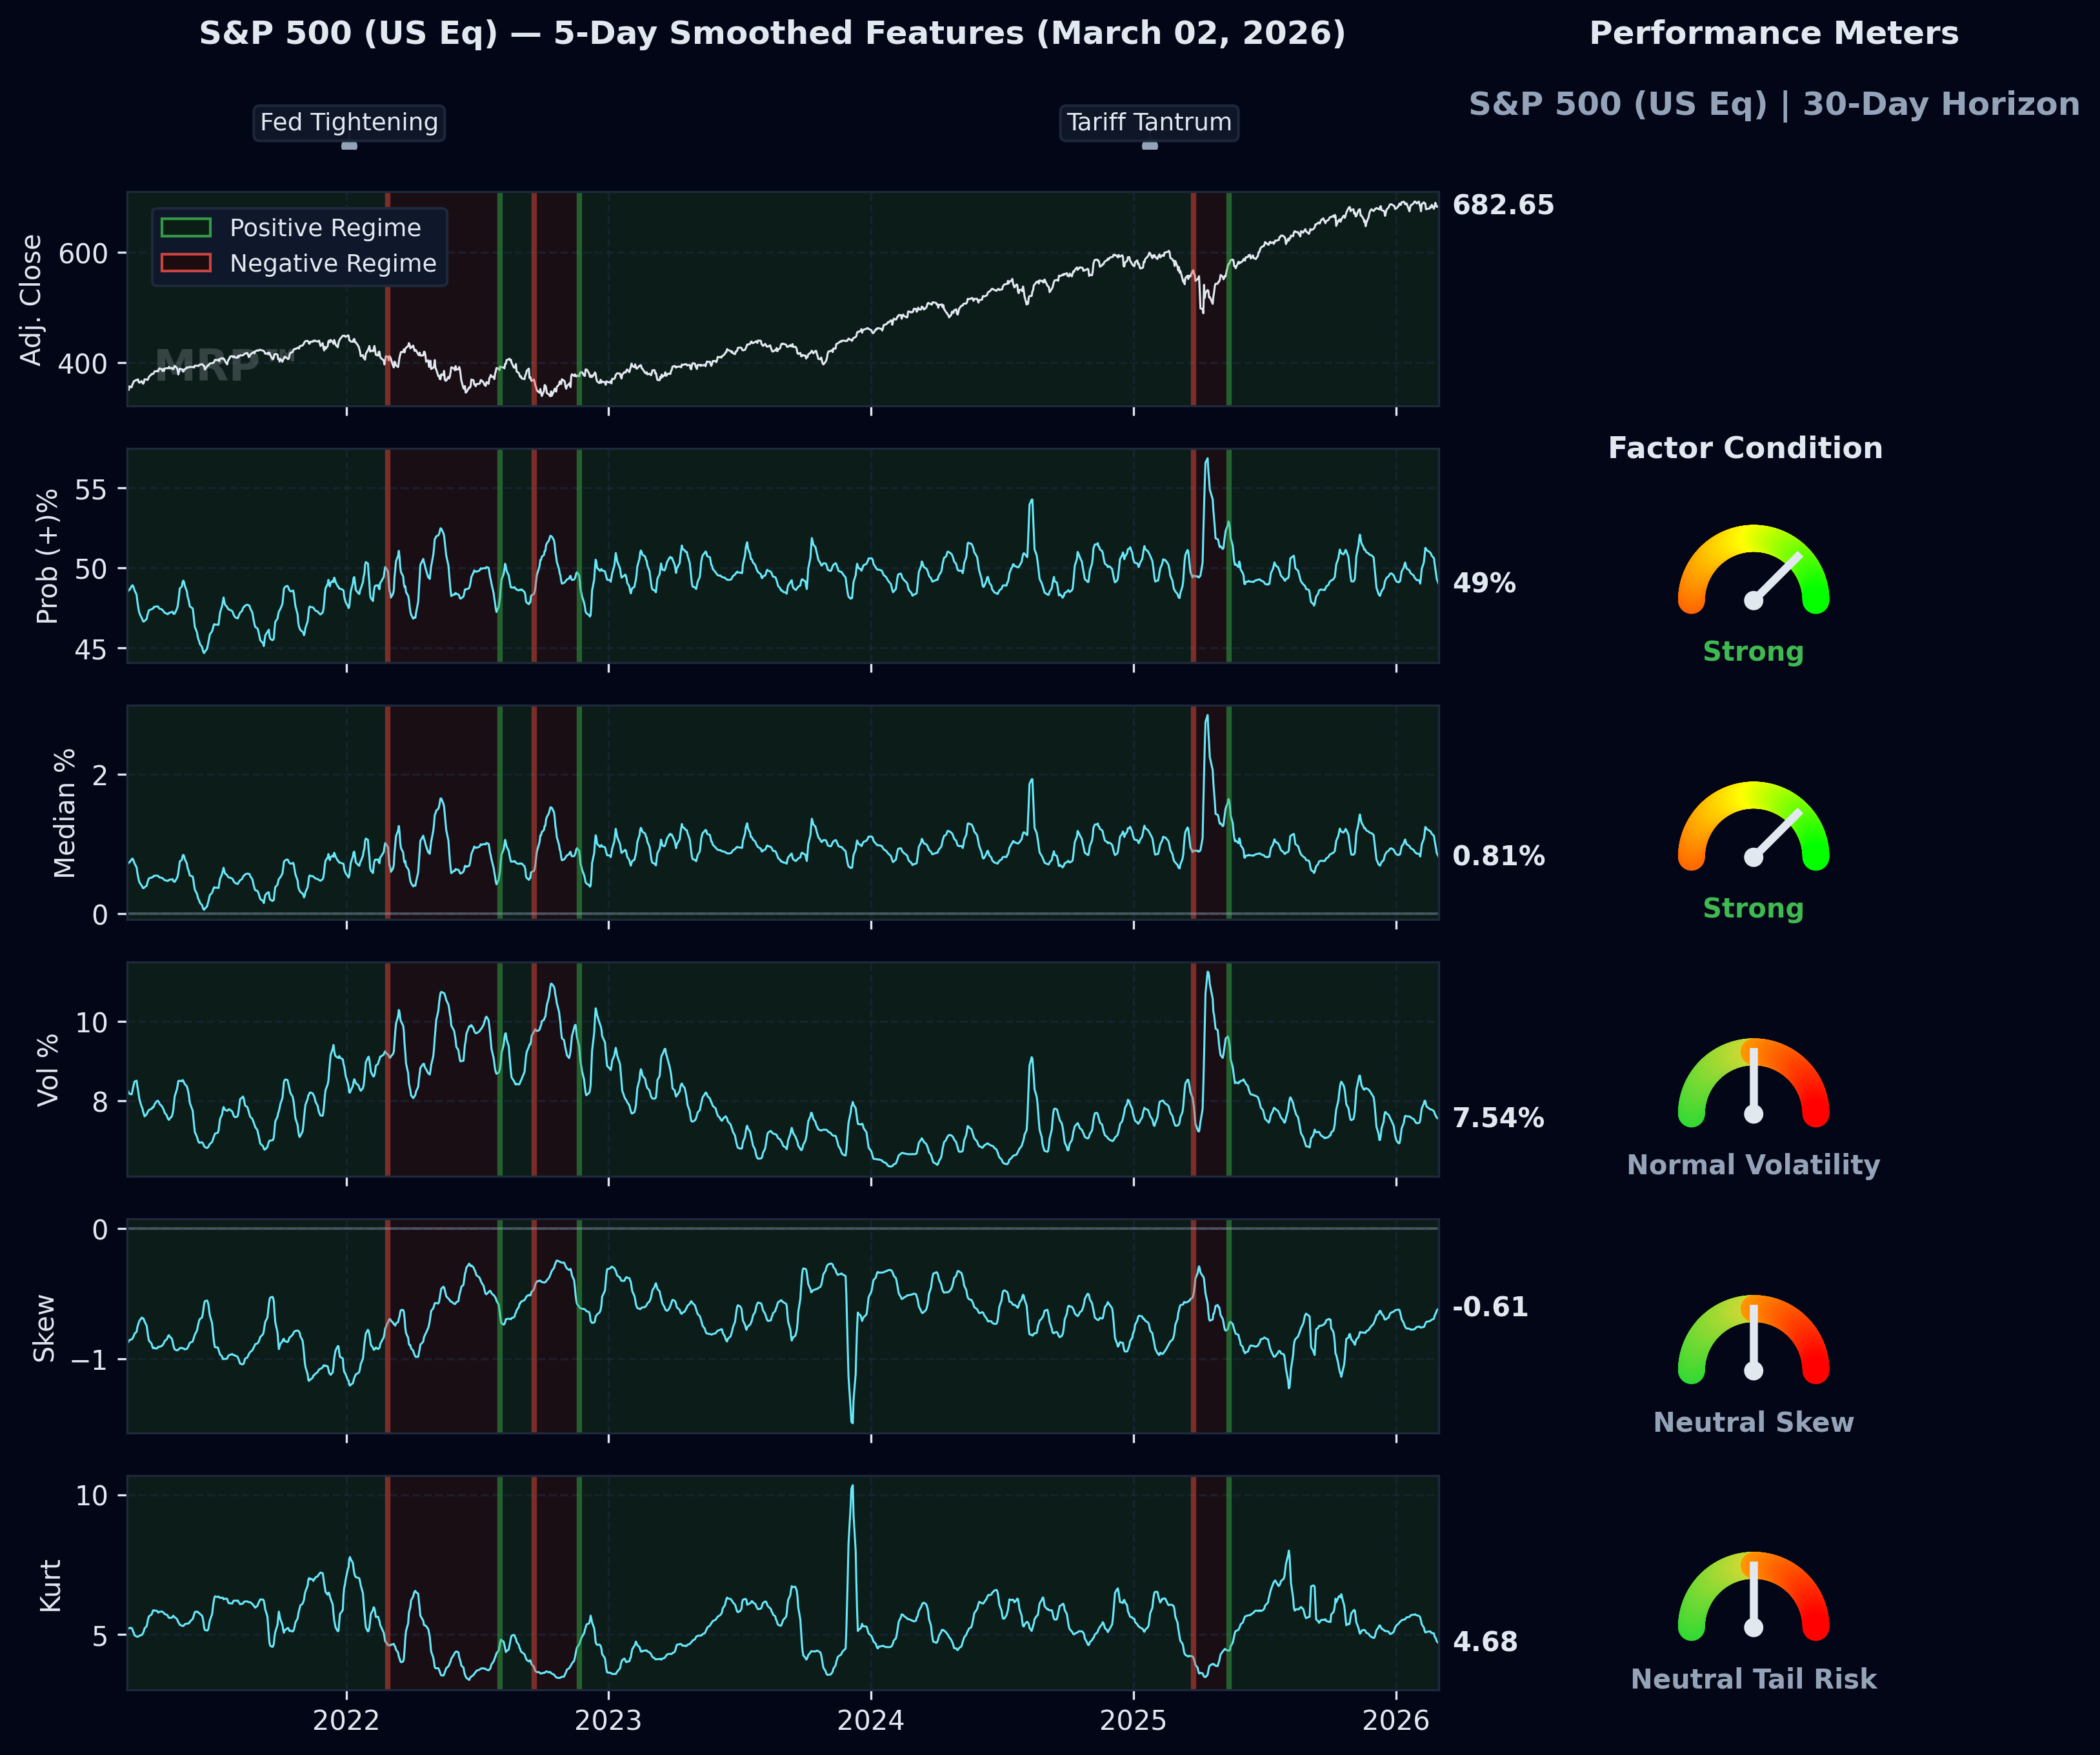
Time Series of Distribution Parameters

Time series of distribution parameters
For example, it is possible to express how market expectations have evolved historically, which can be used to identify regime shifts that do not show up in traditional variance-only frameworks.
Chart 3

Realized forward return vs predicted median return

Realized forward return vs predicted median return by decile
This chart illustrates how the realized forward return has varied across the top and bottom predicted median return deciles over the past ten years. Reflecting how a simple signal can provide additional useful information about potential market outcomes.
Chart 4

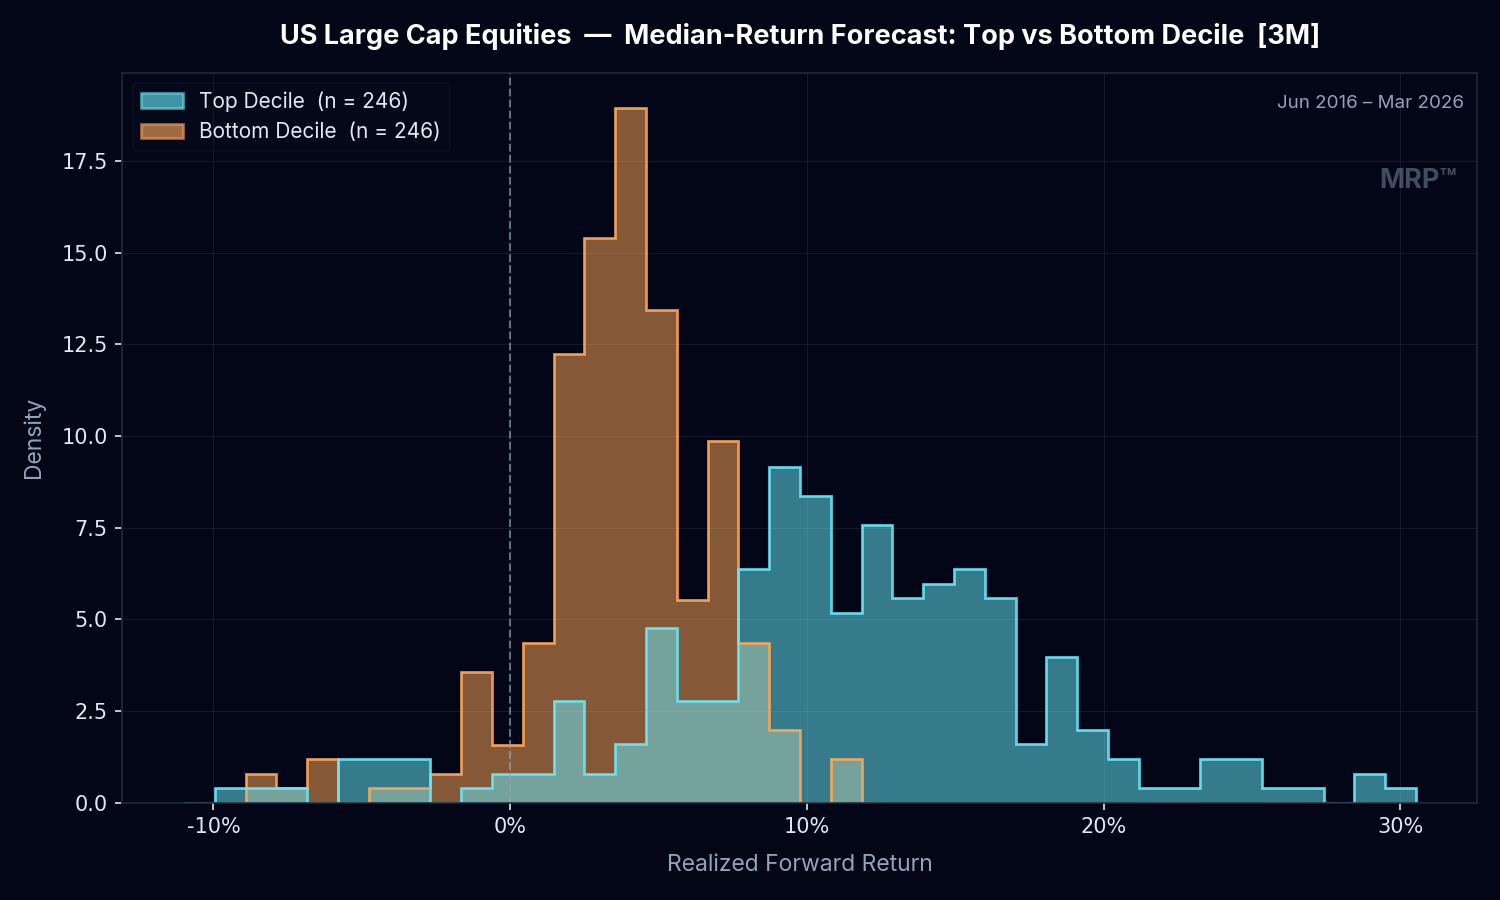
An example of a simple analysis

Simple analysis
For example, a simple analysis of the probabilities of negative returns derived from the current distributions of asset classes can help to inform tactical allocation decisions, risk management, and hedging considerations.
Illustrative Applications

MRP provides distributions. Strategies presented here are only examples.

Clients retain control of their own process and strategies. MRP enhances decision-making by providing a forward-looking, market-derived input layer and selected derived signals that can be incorporated into existing frameworks.

Signal Philosophy

Signals should be considered high-confidence rather than exhaustive. For example, when an MRP drawdown warning appears, it has generally been associated with subsequent potential drawdown environments, but will not identify every drawdown.

Asset Allocation

Replace backward-looking assumptions with market-implied distributions that capture asymmetry and tail risk before capital is allocated.

Risk Oversight

Monitor changes in skew and tail behavior as early indicators that risk is becoming less well compensated.

Portfolio Analytics

Incorporate the distributions into your own portfolio construction, scenario analysis, and internal research framework.

Board/Committee Communication

Support investment decisions with observable market information rather than relying solely on historical assumptions or qualitative narrative.

Feeds: Get on the Grid

A sharper edge for strategy, research, and risk management.

1Integrate with distribution feeds that enhance proprietary analytics and processes
2Use multi-horizon return densities to put better bounds on the stability of signals
3Create tighter links between past and current decisions with our proper-forecast framework
4Visualize the structure and evolution of returns that the markets themselves are predicting
WHAT MARKETS ARE THINKING

Markets continuously price the future. MRP helps clients capture that information in a form they can actually use and explain.